We spent a year researching how social enterprises and the foundations and impact investors who fund them measure the social impact of thier work. What we learned was surprising. Rather than publish a paper report we created this interactive microsite to share our research findings.
Portfolio Category: Web Tools
-
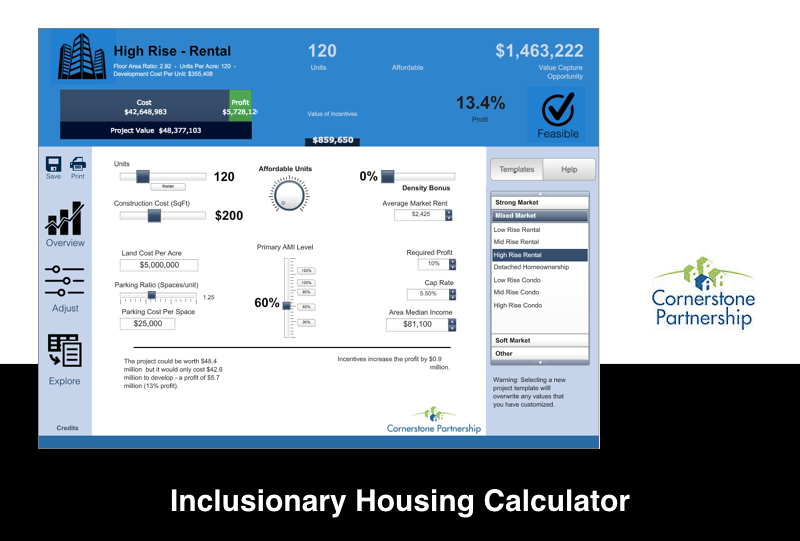
Inclusionary Housing Calculator
This interactive tool published by Grounded Solutions Network was designed to help policymakers and advocates better understand the real estate economics related to inclusionary housing. The tool incorporates a complete real estate project pro forma but simplifies the inputs and outputs to allow users to focus on the key variables that drive project feasibility. Street Level Advisors led the development of the tool and defined the underlying financial model. We have developed custom regional models for the Twin Cities, Metro Vancouver and the Province of Ontario.

Access the calculator at calc.InclusionaryHousing.org
-
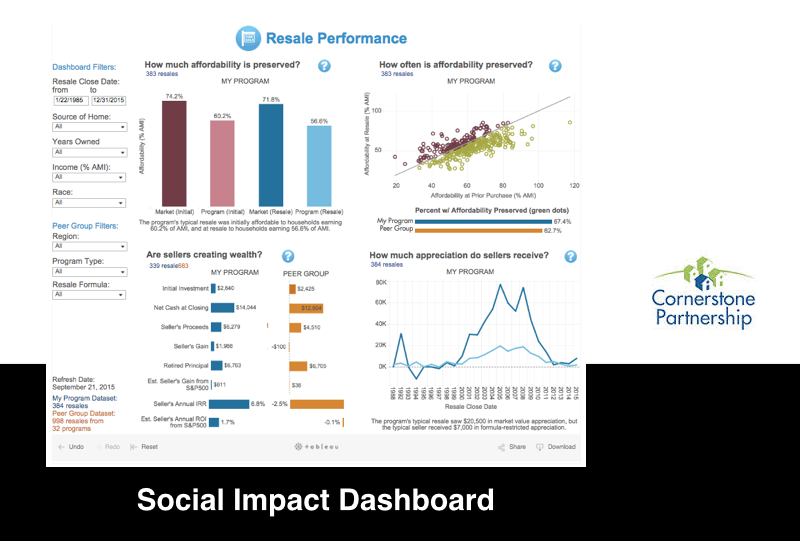
Social Impact Dashboard

Users of the HomeKeeper application enter data about their programs as a routine part of using the tool to get the job done. But HomeKeeper was designed to also provide a high level view into the social performance of the entire affordable homeownership sector. It does that by aggregating data from all of the HomeKeeper users into a single national data hub.
The Social Impact Dashboard allows HomeKeeper users and others to engage with this data and better understand the performance of their organizations relative to their peer group.
Play with the data yourself at MyHomeKeeper.org
-
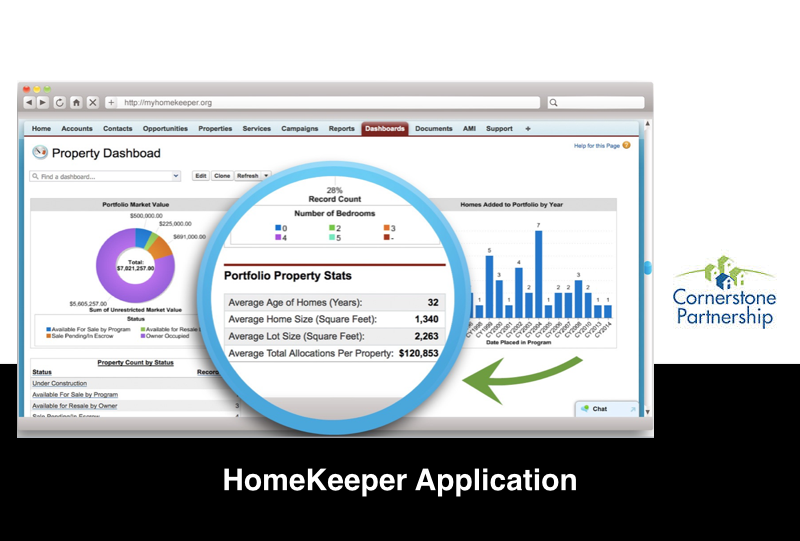
HomeKeeper
HomeKeeper is a Salesforce.com application designed to help managers of affordable homeownership programs to track key program data and monitor the social impact of their programs.
Learn more about it at MyHomeKeeper.org
-
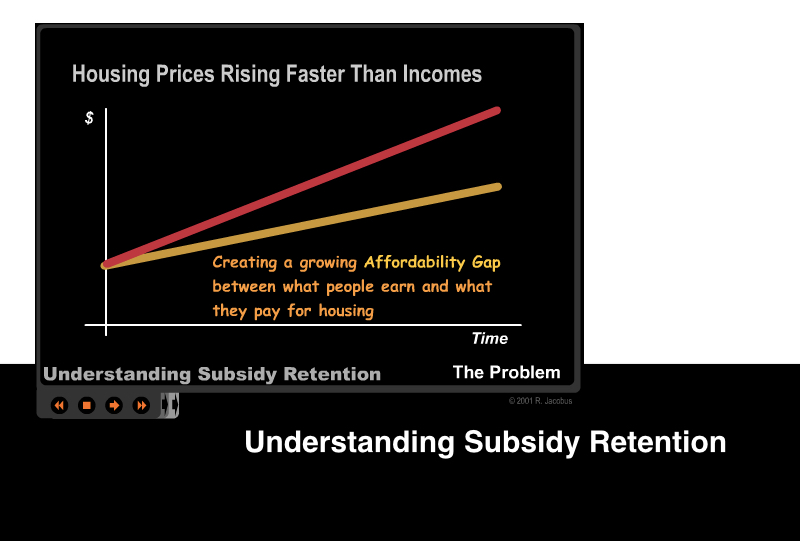
Understanding Subsidy Retention
We created this interactive tutorial on the economics of permanently affordable housing after trying to explain these concepts to small groups with static PowerPoint slides. The key to understanding the growing homeownership affordability challenge is the relative rates of change of housing prices and incomes. This idea is difficult to explain verbally but is relatively easy for people to understand with the help of simple drawings.
The presentation has proven extremely popular and has been shown to thousands of people at a series of housing and urban development conferences. The latest version includes an imbedded voice narration. The presentation can also be run without the audio with either full text narration on screen or with bulleted text for live presentations to groups.
View Interactive Animation at Burlington Associates